Analytics & Automation
Know Your Numbers, Without Needing to Be an Accountant
Ask most business owners how their pipeline, or their marketing, or their cash flow is actually performing, and you'll often get a guess rather than a number. That's usually not because the information doesn't exist — it's scattered across different screens, and pulling it together takes longer than most people have spare.
One starting point for every report
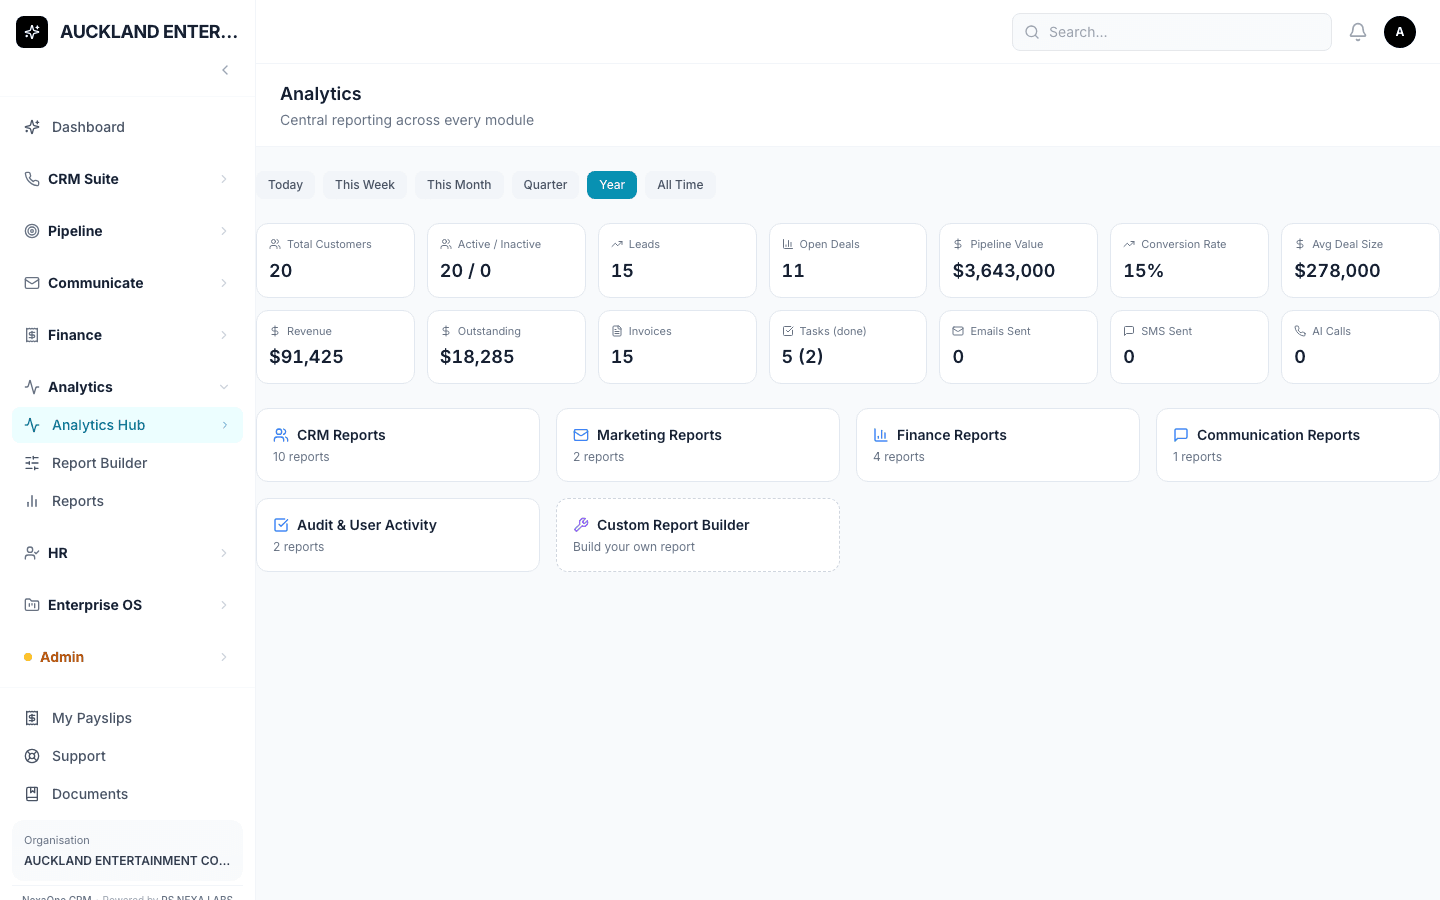
The Analytics Hub is a single screen for ready-made reports — sales, clients, money coming in, and more. Pick a report, choose a date range (Today, This Month, This Quarter, whatever suits), and switch between a table or a chart. Star the ones you check often as favourites, and you can even have a report emailed to you automatically — daily, weekly or monthly — without opening the CRM at all.
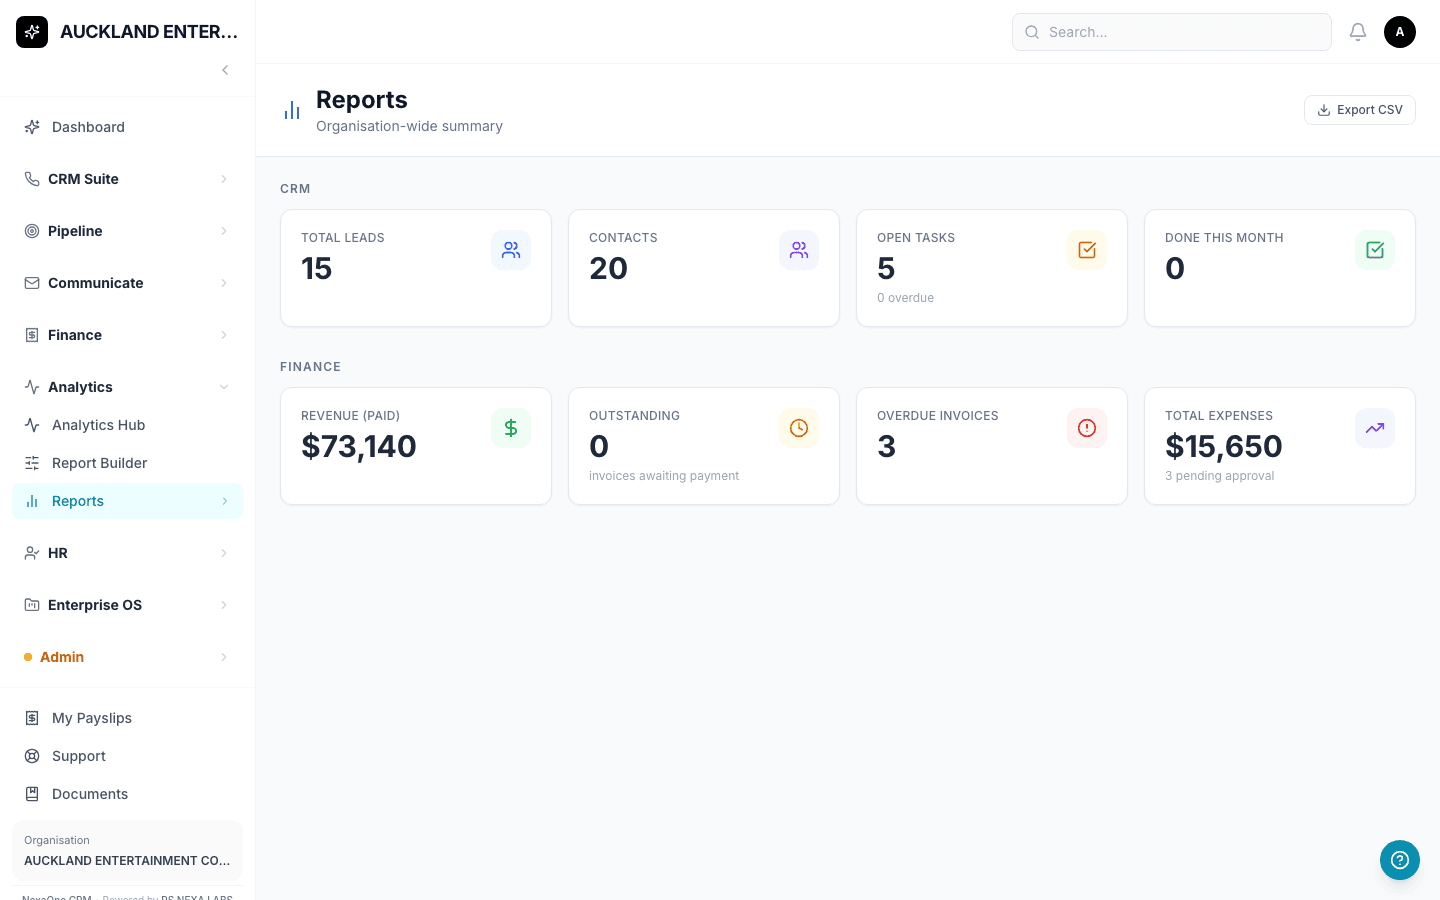
A one-click summary for a quick check
When you just want a fast health check rather than a deep dive, the Reports page gives a simple one-page summary with a single Export CSV button — good for a Monday-morning glance before a team meeting.
Building exactly the report you actually need
When neither of those shows exactly what you're after, Report Builder lets you pick a topic (like Contacts or Invoices), choose which columns matter to you, add filters, and run it — then save it so you're not rebuilding it from scratch next month.
The point isn't more data. It's a straight answer, in under a minute, to "how are we actually doing?"